
How to Calculate Your Cost per Enquiry and Cost per Customer
Spending R3,000 on marketing tells you how much you spent. It does not tell you whether that money produced useful enquiries or customers. These simple calculations help connect the two.
Spending R3,000 on marketing tells you how much you spent. It does not tell you whether that money produced useful enquiries or customers. These simple calculations help connect the two.
You spend money on Google Ads.
Someone else manages your Facebook page.
You pay for a website.
You have a directory listing.
Customers also arrive through referrals.
At the end of the month you know what several of those activities cost.
But can you answer:
How much did each genuine enquiry cost us?
Or:
How much did it cost us to acquire each new customer?
Those numbers can help you compare marketing channels much more meaningfully than views, followers or clicks alone.
You do not need advanced financial software to calculate them.
You need:
And a consistent way of deciding what belongs in each number.
Quick answer
Use these two basic formulas:
Cost per enquiry
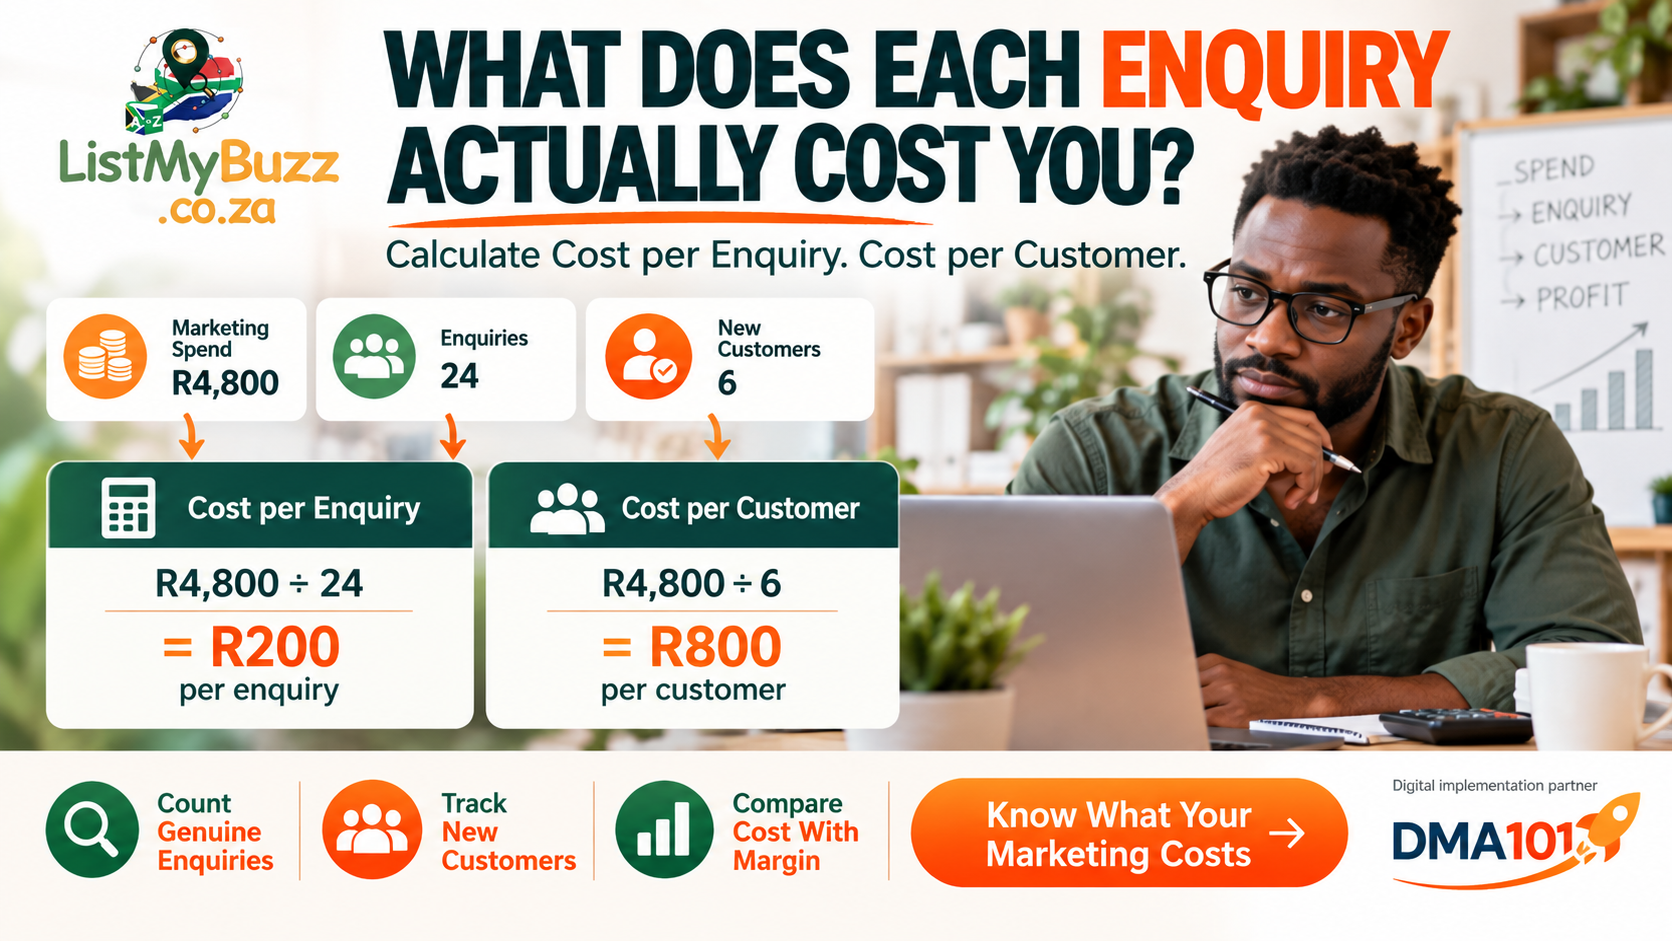
Marketing cost ÷ genuine enquiries = cost per enquiry
If you spend R4,800 on a marketing channel and receive 24 genuine enquiries:
R4,800 ÷ 24 = R200 per enquiry
Cost per customer
Marketing cost ÷ new customers acquired = cost per customer
If those R4,800 in marketing costs eventually produce 6 new customers:
R4,800 ÷ 6 = R800 per customer
Those numbers are not automatically good or bad.
The next question is whether the customers are profitable enough to justify what it cost to acquire them.
In this guide
- 1.What cost per enquiry means
- 2.How to calculate cost per enquiry
- 3.How to calculate cost per suitable enquiry
- 4.What cost per customer means
- 5.Cost per customer vs customer acquisition cost
- 6.Which marketing costs to include
- 7.How to deal with free marketing channels
- 8.How to compare marketing channels
- 9.Why the cheapest enquiry is not always the best
- 10.How profit margin changes the answer
- 11.How to handle repeat customers
- 12.Common calculation mistakes
- 13.A simple monthly marketing-cost tracker
- 14.When CRM and attribution tools become useful
- 15.Your cost-per-enquiry checklist
- 16.Frequently asked questions
- 17.The bottom line
What is cost per enquiry?
Cost per enquiry tells you how much marketing expenditure was required, on average, to generate one genuine customer enquiry.
The basic formula is:
Cost per enquiry = marketing cost ÷ number of genuine enquiries
The important word is:
genuine.
Do not count:
You are trying to measure people who genuinely contacted the business about potentially buying what you offer.
Example: calculating cost per enquiry
Imagine a Johannesburg cleaning company spends:
R3,600 on a Google Ads campaign
During the measurement period, the business receives:
18 genuine cleaning enquiries attributed to the campaign
The calculation is:
R3,600 ÷ 18 = R200
So the:
Cost per enquiry = R200
That tells you something useful.
But not enough.
You still don't know whether those 18 enquiries were suitable.
Add cost per suitable enquiry
This is where marketing analysis becomes more useful.
Suppose those 18 enquiries include:
6 outside your service area
3 asking for services you don't offer
That leaves:
9 suitable enquiries
Your cost per suitable enquiry is:
R3,600 ÷ 9 = R400
That is a very different number.
The original dashboard might make the campaign look like:
R200 per enquiry
But from an operational perspective, the business is actually paying:
R400 for each relevant opportunity
This is why tracking enquiry quality matters, not only total enquiry volume.
Use three levels of enquiry measurement
A useful small-business marketing report can separate:
| Stage | What it means |
|---|---|
| Enquiry | Someone genuinely contacted the business |
| Suitable enquiry | The customer fits your service, location and basic requirements |
| Customer | The enquiry ultimately became actual business |
This creates a clearer journey:
Marketing spend
Stage 1Enquiries
Stage 2Suitable enquiries
Stage 3Customers
Stage 4You can calculate a cost at each stage.
Cost per enquiry formula
Use:
Channel marketing cost ÷ genuine enquiries
Example:
Spend: R6,000
Enquiries: 30
R6,000 ÷ 30 = R200
Cost per enquiry: R200
Cost per suitable enquiry formula
Use:
Channel marketing cost ÷ suitable enquiries
Example:
Spend: R6,000
Suitable enquiries: 15
R6,000 ÷ 15 = R400
Cost per suitable enquiry: R400
Cost per customer formula
Use:
Marketing cost ÷ new customers acquired
Example:
Spend: R6,000
New customers: 5
R6,000 ÷ 5 = R1,200
Cost per customer: R1,200
Now the channel looks like this:
| Metric | Result |
|---|---|
| Marketing spend | R6,000 |
| Enquiries | 30 |
| Suitable enquiries | 15 |
| New customers | 5 |
| Cost per enquiry | R200 |
| Cost per suitable enquiry | R400 |
| Cost per customer | R1,200 |
All figures above are illustrative examples only. They are not ListMyBuzz benchmarks or recommended marketing costs.
What does cost per customer actually mean?
At its simplest, it answers:
How much did we spend to gain each new customer?
This number is often referred to as customer acquisition cost, or CAC.
However, there is an important distinction.
Simple channel-level cost per customer
For practical marketing comparison, you might calculate:
Google Ads spend ÷ customers attributed to Google Ads
This lets you compare channels.
Broader customer acquisition cost
A more complete business-wide CAC may include more than advertising. It could include relevant:
The more costs you include, the more complete the figure becomes.
The key is consistency.
Do not calculate Facebook using only advertising spend and compare it with Google using advertising, agency fees and staff wages. You would be comparing two different definitions.
Decide what costs you are measuring
A practical approach is to calculate two versions.
1. Direct media cost
Include only the money paid directly to the advertising platform.
For example: Google Ads spend. This is useful for campaign comparison.
2. Fully loaded marketing cost
Include all directly relevant costs such as:
This gives a broader picture of what customer acquisition actually costs your business. Label the figures clearly so you know what you are comparing.
Example: the difference can be significant
Imagine your Meta advertising shows:
Ad spend: R5,000
New customers: 10
If you calculate only platform spend:
R5,000 ÷ 10 = R500 per customer
But suppose you also paid:
R2,000 campaign management
R1,000 for creative work
Your total acquisition cost becomes:
R8,000
Now:
R8,000 ÷ 10 = R800 per customer
Both calculations are technically useful. They simply answer different questions.
R500 tells you the media-spend cost.
R800 gives you a broader channel cost.
Don't pretend organic marketing costs nothing
You may say:
"Facebook is free because I don't run ads."
But suppose you spend six hours each week creating posts, answering comments and making videos.
Your cash advertising spend may be R0.
Your time cost is not necessarily R0.
The same applies to:
You do not have to turn every hour into a perfect rand value. But when comparing channels, at least record:
Time required: Low / Medium / High
That helps prevent a channel that consumes 20 hours a month from appearing completely free.
Referrals have costs too, even when advertising spend is zero
Word-of-mouth marketing may have no direct advertising bill. But the business still invests in:
The cost may be low compared with advertising, which can make referrals extremely valuable. But do not force an artificial R0 cost into your analysis if significant resources are involved.
What if a channel produced zero enquiries?
Suppose you spent:
R2,500
and received:
0 genuine enquiries
Do not write:
Cost per enquiry = R0
That would be incorrect.
You cannot divide R2,500 by zero.
Record:
Spend: R2,500
Enquiries: 0
Cost per enquiry: Not calculable because no enquiries were generated
That result itself is important. Investigate what happened.
The cheapest enquiry isn't automatically the best enquiry
Imagine:
Channel A
Cost per enquiry:
R80
But most enquiries are unsuitable.
Channel B
Cost per enquiry:
R300
But most enquiries fit your business and several become customers.
Channel A is cheaper. That does not automatically make it better.
Compare the journey all the way through. For example:
| Metric | Channel A | Channel B |
|---|---|---|
| Spend | R4,000 | R4,000 |
| Enquiries | 50 | 15 |
| Suitable enquiries | 8 | 12 |
| Customers | 2 | 6 |
| Cost per enquiry | R80 | R267 |
| Cost per customer | R2,000 | R667 |
These are fictional figures designed only to illustrate the calculation.
Looking only at cost per enquiry would make Channel A look excellent.
Looking at customer outcomes tells a different story.
Customer quality matters too
Even cost per customer doesn't tell you everything.
Suppose:
Channel A costs R600 per customer
Channel B costs R1,000 per customer
At first glance, Channel A seems better.
But what if customers from Channel A typically buy:
R700 once
while customers from Channel B typically become:
R8,000 projects
The higher acquisition cost may be completely reasonable.
You need to compare acquisition cost with customer economics.
How profit margin changes the answer
This is an important distinction.
Suppose it costs:
R800 to acquire a customer
The customer buys work worth:
R2,000
You might think:
"Great, we made R1,200."
Not necessarily.
You may still have:
The more useful comparison is often:
Customer acquisition cost vs gross profit contribution
not simply:
Customer acquisition cost vs revenue
Example: why margin changes everything
Imagine two businesses each pay:
R500 to acquire a new customer
Business A
- Customer revenue: R1,000
- Direct costs: R700
- Gross profit before marketing: R300
- Marketing acquisition cost: R500
That first transaction is not covering acquisition cost.
Business B
- Customer revenue: R4,000
- Direct costs: R1,500
- Gross profit before marketing: R2,500
- Marketing acquisition cost: R500
That gives the business much more room.
This is why there is no universal statement such as: "R500 per customer is expensive." The answer depends on your margins and customer value.
ListMyBuzz provides a free Profit Margin Calculator designed to help South African business owners calculate profit, margin, markup and break-even figures.
Calculate your margin before deciding what you can afford
Before deciding whether your customer acquisition cost is acceptable, understand:
Then ask:
How much of that gross profit can we realistically afford to spend acquiring the customer?
There is no universal percentage. The answer depends on:
Do not copy another company's acceptable CAC just because you saw it online.
How to handle repeat customers
This can significantly change your analysis.
Suppose the first job generates:
R1,000 gross profit
and acquiring the customer cost:
R700
That may look tight.
But what if that customer returns four times over the next two years without another large acquisition expense? Their total value becomes more attractive.
This is why established businesses sometimes consider customer lifetime value, often abbreviated to CLV or LTV.
Keep lifetime-value estimates realistic
Do not assume:
"Every customer will stay with us for five years."
Use actual historical behaviour where possible. For example:
Average customer purchases: 2.3 times
may be useful if based on real records.
A fictional lifetime value number can justify almost any marketing spend. Use evidence.
For a new business with little history, focus first on the first purchase and build better customer-value estimates over time.
Track new and returning customers separately
Your cost-per-customer calculation should usually focus on new customers acquired.
If a previous customer returns because they already know your business, they are not necessarily a new acquisition.
For example:
Marketing spend: R6,000
Customers during period: 12
But:
5 are returning customers
Only:
7 are new
If your goal is measuring acquisition:
R6,000 ÷ 7 = R857.14 per new customer
not:
R6,000 ÷ 12 = R500
Otherwise your acquisition cost can look artificially low.
Attribution matters
An important distinction:
Where the customer discovered you
is not always:
How the customer eventually contacted you
Someone may:
See you on Facebook.
Search your business on Google.
Visit your website.
Then phone.
Which channel gets credit?
There is no perfect answer for every small business. The important thing is to use a consistent attribution method.
Choose a method and label it clearly. Do not change the rule every month to make one channel look better.
Match your measurement period to your sales cycle
This is another common calculation mistake.
Suppose you spend:
R10,000 in September
but many customers who responded to those campaigns only make decisions in October.
If you calculate:
September spend ÷ September customers
you may understate performance.
Businesses with longer decision cycles may need:
60-day
or:
90-day
measurement windows.
A kitchen-renovation company may need a different measurement period from a barber. Use a timeframe that reflects how customers actually decide.
Don't compare different months blindly
Seasonality can affect results. For example:
may have stronger or weaker periods during the year. If your cost per customer increases during a quiet month, that does not automatically mean the channel is broken. Compare several periods when possible.
Calculate blended cost per customer
So far we have looked at individual channels. You can also calculate your overall or blended acquisition cost.
Use:
Total acquisition spending ÷ total new customers acquired
Example:
Monthly marketing costs
Google: R4,000
Meta: R2,500
Directory and listing costs allocated for the period: R500
Marketing support: R2,000
Total acquisition cost: R9,000
New customers attributed during the appropriate period:
15
R9,000 ÷ 15 = R600
Your blended cost per new customer is:
R600
This gives you a useful overall benchmark for your own business.
Channel cost vs blended cost
Both numbers have value.
Channel cost helps answer:
Which channel appears more efficient?
Blended cost helps answer:
What does customer acquisition cost us overall?
Do not confuse the two.
Build a simple monthly marketing-cost tracker
You can track this in a spreadsheet:
| Channel | Cost | Enquiries | Suitable Enquiries | New Customers | CPE | Cost per Customer |
|---|---|---|---|---|---|---|
| Actual | Actual | Actual | Actual | Formula | Formula | |
| ListMyBuzz | Actual | Actual | Actual | Actual | Formula | Formula |
| Social | Actual | Actual | Actual | Actual | Formula | Formula |
| Referrals | Actual | Actual | Actual | Actual | Formula | Formula |
| Paid Ads | Actual | Actual | Actual | Actual | Formula | Formula |
Then add:
only if those figures genuinely help your decisions.
The ListMyBuzz Expense Tracker can also help businesses record expenses and review basic profit information, which makes it relevant when marketing costs are being tracked alongside other business spending.
Example: comparing three channels
Imagine a small Gauteng home-services company reviewing its own numbers. All figures below are fictional.
| Metric | Social Ads | Referrals | |
|---|---|---|---|
| Cost | R6,000 | R3,000 | R500 |
| Enquiries | 20 | 24 | 5 |
| Suitable | 15 | 8 | 5 |
| Customers | 8 | 2 | 4 |
| Cost per enquiry | R300 | R125 | R100 |
| Cost per customer | R750 | R1,500 | R125 |
If the owner looked only at enquiry cost:
Referrals look best.
Social looks second.
Google looks most expensive.
But cost per customer tells a different story:
Referrals remain strongest.
Google becomes considerably more attractive than social advertising.
The correct business decision could be:
not simply: "Spend everything on the source with the cheapest enquiry."
Investigate the journey before cutting a channel
A high cost per customer can have several causes.
High cost per enquiry
Possible issues:
Low enquiry quality
Possible issues:
Many good enquiries but few customers
Possible issues:
Customers generated but poor profitability
Possible issues:
The marketing channel may not be the only problem.
Cost per enquiry can improve without spending less
Suppose marketing spend remains:
R5,000
but you improve your landing page and enquiry process.
Before:
10 enquiries
Cost per enquiry:
R500
After:
20 genuine enquiries
Cost per enquiry:
R250
You didn't reduce the advertising budget. You improved what happened after people encountered the campaign.
This is why websites, landing pages and customer response processes matter.
Cost per customer can improve through better follow-up
Imagine:
R5,000 marketing spend
20 suitable enquiries
But only:
2 customers
Cost per customer:
R2,500
Now suppose the business improves response time and quotation follow-up, and 5 of those enquiries become customers.
The same R5,000 now produces:
R1,000 per customer
Again, the improvement did not come from cheaper advertising. It came from what happened after the enquiry.
ListMyBuzz Growth Tools are positioned around CRM workflows, lead follow-up, reminders, booking and customer communication for businesses that need more structure after enquiries arrive.
Do not confuse cost per click with cost per enquiry
These are completely different measurements.
Suppose your advertising platform reports:
Cost per click: R8
That does not mean:
Cost per enquiry: R8
If 100 people click:
100 × R8 = R800
but only 4 people enquire:
R800 ÷ 4 = R200 per enquiry
And if only one becomes a customer:
R800 ÷ 1 = R800 per customer
Each metric describes a different stage.
Do not confuse leads with customers
Marketing platforms may label a form completion as:
Lead
That does not guarantee the person:
Your internal records should connect marketing leads to actual customer outcomes.
What is a good cost per enquiry?
There is no universal number.
Anyone telling every South African business that:
"R50 per enquiry is good"
or:
"R500 per enquiry is bad"
is ignoring the economics of different businesses.
A relevant enquiry for:
cannot all be evaluated using the same acceptable acquisition cost. Your acceptable cost depends on your own:
What is a good cost per customer?
Again, there is no universal answer.
Ask:
A customer may be profitable over time while still creating short-term cash-flow pressure.
Know your own numbers.
A useful marketing-cost diagnostic
For each channel, answer four questions:
What did we spend?
Use a consistent cost definition.
How many genuine enquiries came from it?
Not views or clicks.
How many suitable enquiries became customers?
Track actual outcomes.
Was the resulting work economically worthwhile?
Compare acquisition cost with your margins and customer value.
If you can answer those four questions, you already understand your marketing economics better than you would from traffic statistics alone.
Common calculation mistakes
| Mistake | Better approach |
|---|---|
| Dividing spend by all messages | Count genuine customer enquiries |
| Calling every enquiry qualified | Track suitable enquiries separately |
| Counting returning customers as new | Separate acquisition from repeat business |
| Comparing ad spend with fully loaded channel costs | Use consistent definitions |
| Calling organic channels free | Record time or other real costs |
| Comparing spend this week with customers from previous campaigns | Match the measurement window to the sales cycle |
| Looking only at cost per enquiry | Also calculate cost per customer |
| Looking only at revenue | Compare with gross profit and margin |
| Treating the cheapest enquiry as automatically best | Consider quality and customer outcomes |
| Making decisions from one or two customers | Look for patterns over a meaningful period |
When CRM and attribution tools become useful
A spreadsheet may be enough initially.
Things become harder when you have:
At that point, source tracking and customer outcomes may need to be connected more systematically.
Where DMA101 can assist
Businesses that need broader marketing measurement and implementation support can use DMA101 as the supporting digital-growth partner. This may become relevant when the business needs to connect advertising, website forms, tracking, CRM records, marketing attribution and customer follow-up into a more coherent digital system.
ListMyBuzz remains the primary directory, discovery and business-growth platform. DMA101 should remain the supporting implementation partner, which follows the approved ListMyBuzz editorial and brand structure.
Your cost-per-enquiry checklist
Before trusting the number, check:
Costs
Enquiries
Customers
Business economics
Decision-making
Frequently asked questions
The bottom line
Knowing that you spent R5,000 on marketing is not enough. You need to know what happened afterwards.
Start with:
Cost per enquiry = marketing cost ÷ enquiries
Then go deeper:
Cost per suitable enquiry = marketing cost ÷ suitable enquiries
And finally:
Cost per customer = acquisition cost ÷ new customers
But don't stop at the cheapest number.
Compare the cost with:
The goal is not to make every enquiry as cheap as possible. The goal is to acquire the right customers at a cost your business can sustainably afford.
Understand the numbers behind your marketing
Before deciding whether a marketing channel is expensive, understand what each customer is worth to your business. ListMyBuzz provides a free tool for calculating profit, margin, markup and break-even.
Marketing metrics, CRM tools, directory listings and advertising do not guarantee enquiries, customers, sales or revenue. Results depend on factors including demand, competition, location, pricing, offer quality, implementation and customer response.
Related articles
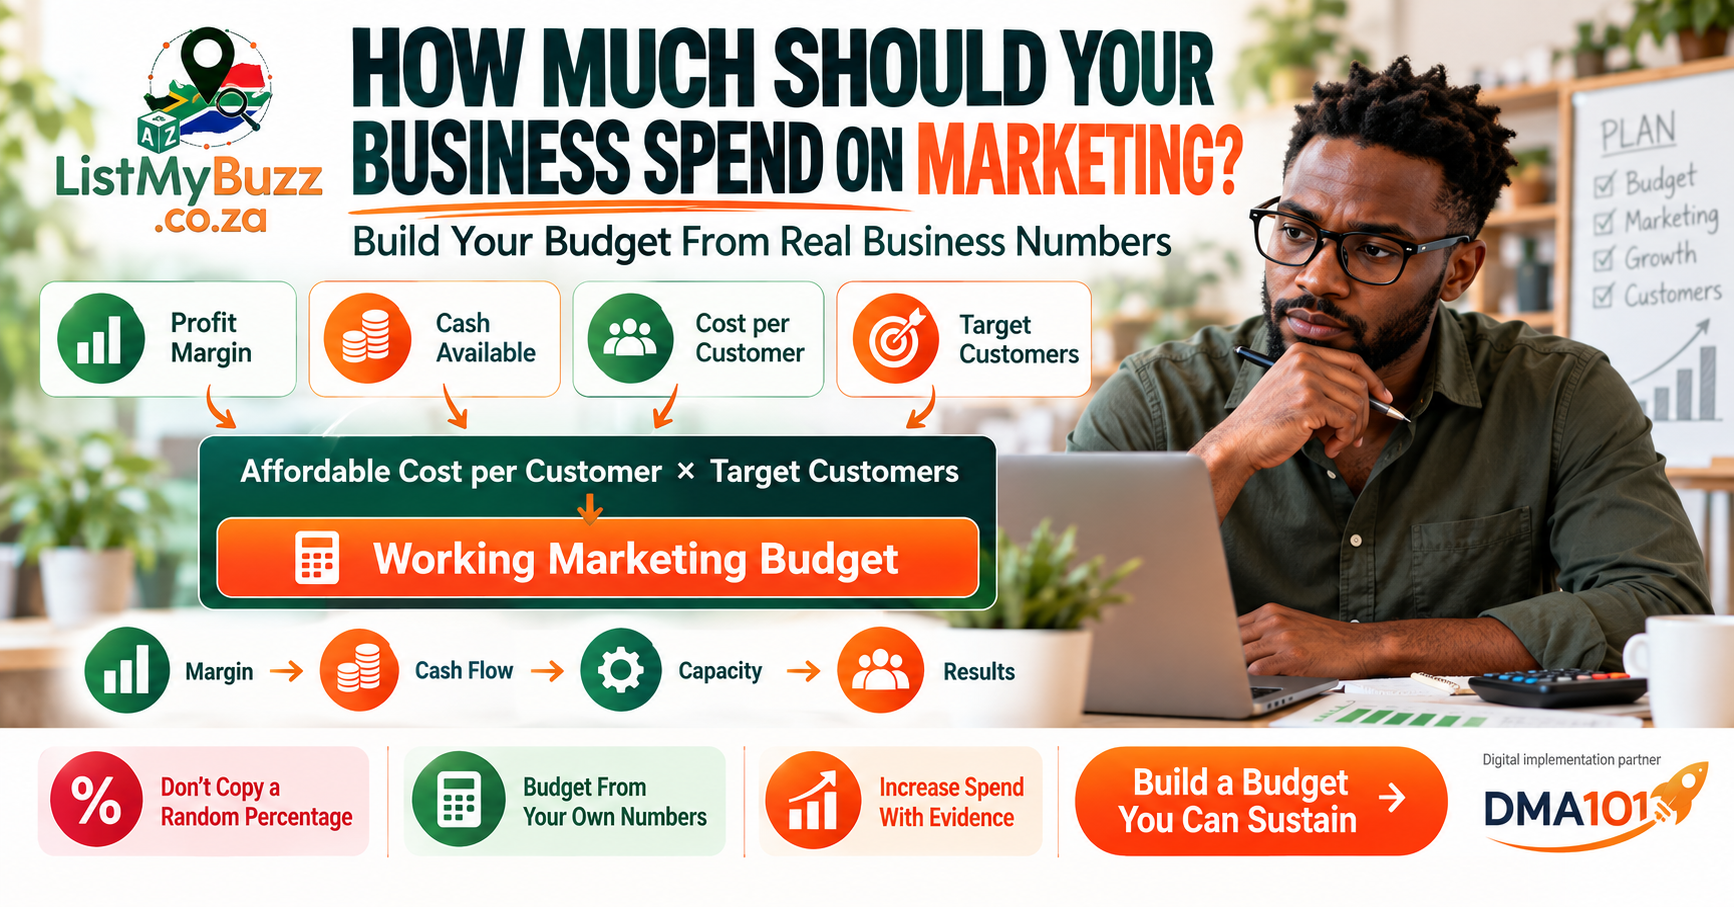
How Much Should a Small Business Spend on Marketing?
Set a realistic marketing budget using your margins, cash flow, customer costs, growth goals and channel results.
Read article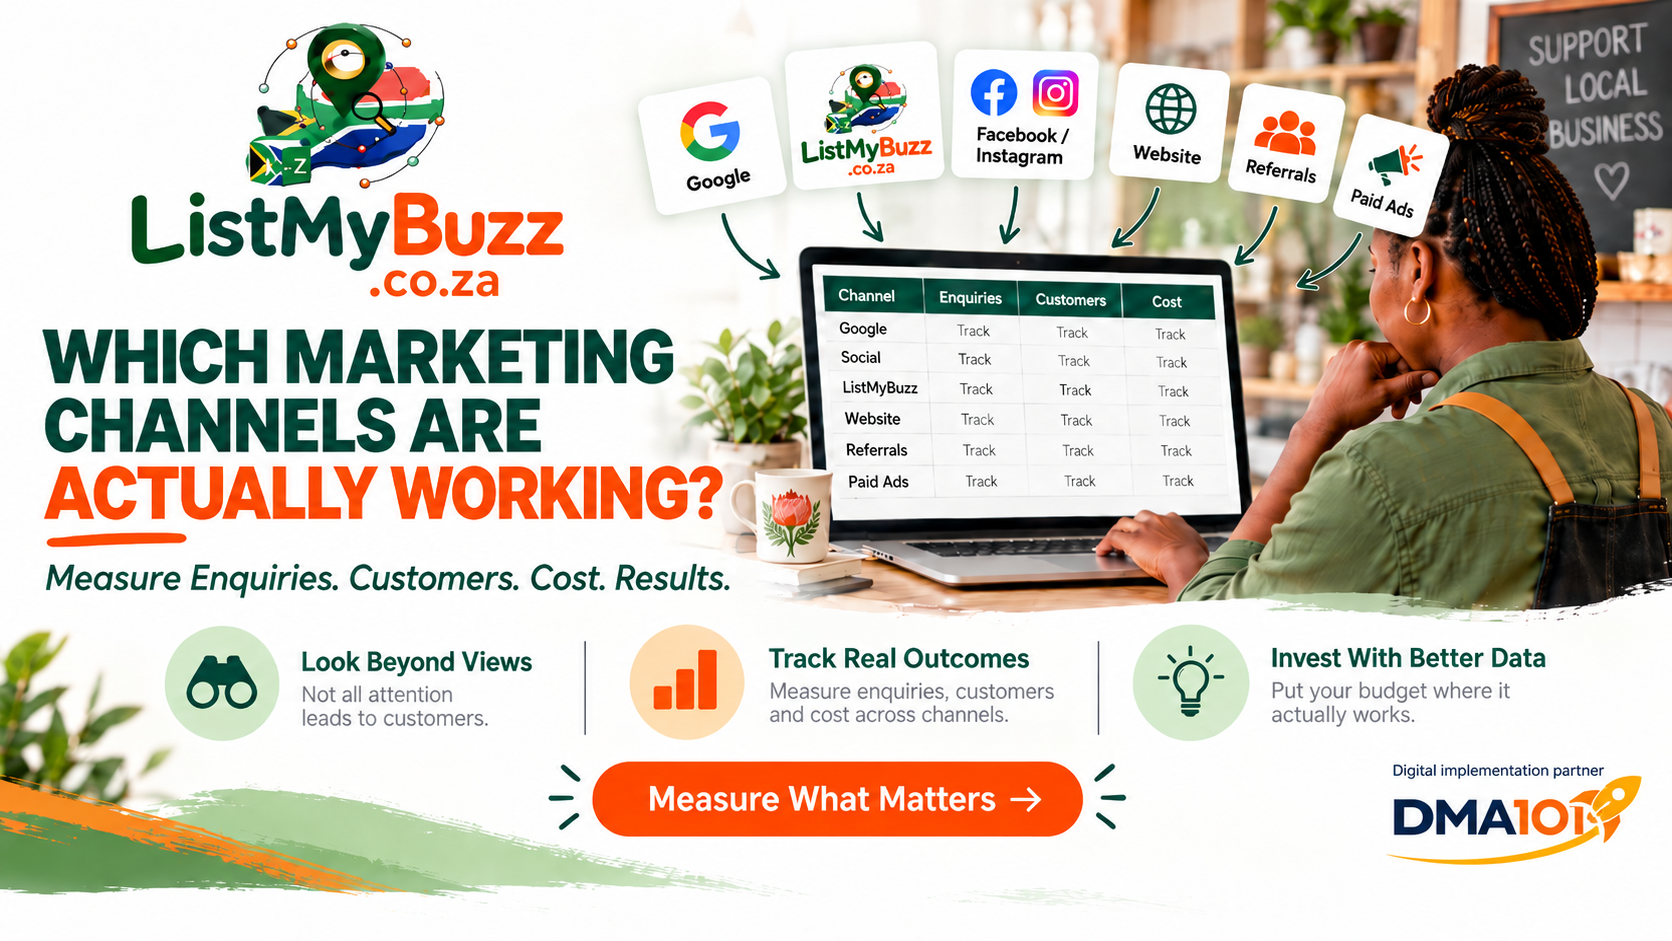
Which Marketing Channels Are Actually Working for Your Small Business?
Stop judging marketing by views alone. Compare enquiries, customer quality, costs, bookings and business outcomes.
Read article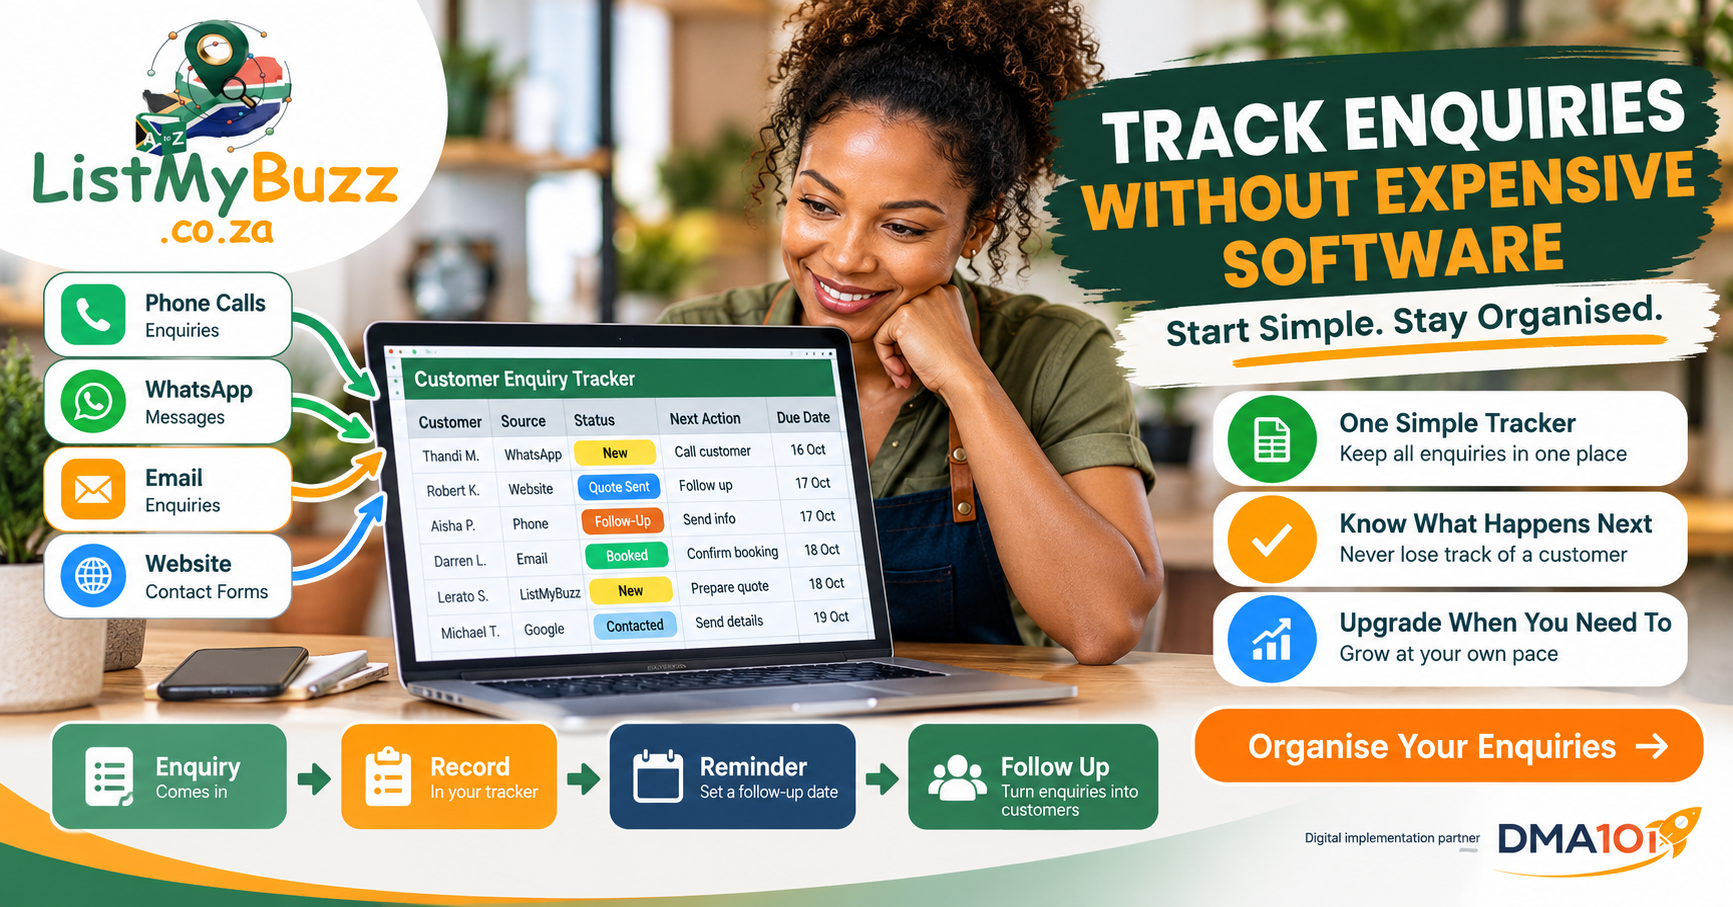
How to Track Customer Enquiries Without Expensive Software
You don't need an expensive CRM to start tracking customer enquiries properly — a spreadsheet and simple routine can take you far.
Read article